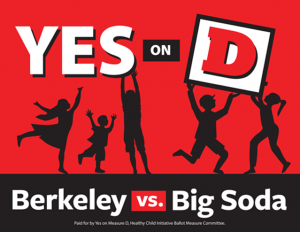
 Berkeley’s soda tax, which passed in a landslide victory in November 2014, was the nation’s first “soda” tax to pass. The tax, a penny-per-ounce tax paid by distributors of sugary drinks, applies to soda, fruit drinks energy drinks, and sugary coffee syrups. Now, the results of most measures to decrease use of substances such as tobacco, alcohol and unhealthy foods such as this one are normally quite difficult to quantify. It is close to impossible to measure the direct correlation between measures such as taxes, prohibition of advertisement, labels and education campaigns and the decreases in use. However, for the case of the Berkeley soda tax, Dr. Kristine Madsen and other researchers at the UC Berkeley School of Public Health came up with a study that would allow them to measure the effects of the tax long before it was passed.
Interviewers surveyed nearly 3,000 people in low-income communities in Berkeley, Oakland and San Francisco before and after the tax went into effect. The “before” set of interviews took place at least 8 months before the tax went into effect, while the “after” picture happened five months after the tax was implemented. The idea was to compare similar communities in Berkeley to those in Oakland and San Francisco, where a tax was not imposed. The residents were asked how often they drank beverages in the following five categories: full-calorie soda, sports drinks, energy drinks, fruit drinks and sweetened tea or coffee. Before the vote, the answers had been very similar in both cities. The average person drank about 1.25 sugary beverages per day.
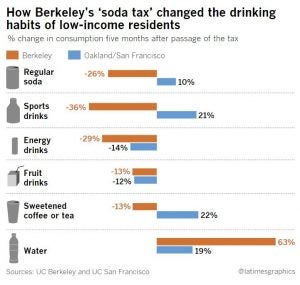
In their report, Impact of the Berkeley Excise Tax on Sugar-Sweetened Beverage Consumption, published in the American Journal of Public Health, Madsen’s team found an overall 21% decline in reported consumption in low-income neighborhoods in Berkeley vs. a 4% increase in equivalent neighborhoods in Oakland and San Francisco. The biggest decrease in consumption was that of soda (26%) and sports drinks (36%). As can be seen in the graphic provided by the LA Times, not only did sugary drinks consumption decrease in Berkeley, but there was also a significantly higher increase in the consumption of water (63%) vs. that of the other two areas (which only increased 19%).
 According to the study, more than one in five Berkeley residents told the survey-takers that the tax had caused them to change their drinking habits. Among these 124 people, 82% said they consumed sugary drinks less frequently, and 40% said they had reduced their portion sizes.
Sin taxes have long proven helpful for tobacco and alcohol. While it is still too early to measure the health impacts of these taxes, these results provide us with hopeful evidence that they can also help consumers steer away from sugary drinks. Kristine Madsen says that a 20 percent reduction in consumption of sugar-sweetened beverages would be enough to reduce rates of obesity and Type 2 diabetes in years to come. “This would have a huge public health impact if it were sustained,” she says. She is not sure it will be sustained. People may be more inclined to react to such a tax when it is new.
Like in tobacco and alcohol control, it is crucial that this tax be followed-up with other measures, precisely so that the change in behavior is sustained. With this tax came a massive advocacy campaign, which also contributed significantly to the decrease in consumption. Education campaigns, restrictions on advertisement, health warnings and labelings need to be part of an integral plan in order to continue lowering rates of consumption and as a result lowering risk factors for obesity and other health concerns.
Three cities in the Bay Area — San Francisco, Oakland and Albany, Calif. — are all looking to follow in the footsteps of Berkeley and Philadelphia, where the city council recently approved a 1.5 cent per ounce fee. Initial evidence from studies such as this one could help tilt the scales in the right direction.